1. Overview
Kiberys Data Horizon is a comprehensive Big Data platform for welding and manufacturing processes. It collects, stores and analyzes large volumes of data in real time from robotic cells and connected equipment. Designed specifically for welding production, it combines Industry 4.0 Big Data analytics with edge computing, making the welding process part of the production Digital Shadow.
Key Features
- Dedicated system database with centralized time-series / Big Data storage.
- Web-based user interface for visualization and analytics.
- Connectivity to the internal Industrial Ethernet network, with each robotic cell operating as an intelligent, IoT-integrated machine.
- Integration with ERP/MES/SCADA systems through standardized APIs.
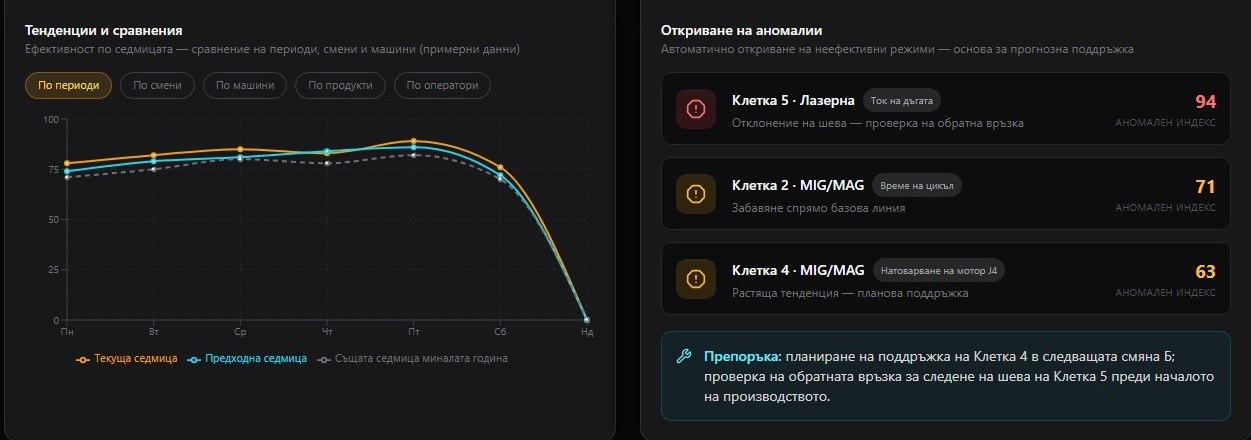
- Foundation for predictive maintenance through automatic detection of anomalies and inefficient operating modes.
2. Platform Modules and Capabilities
01
2.1. Data Acquisition Layer
- Real-time robot controller connectivity and data acquisition: positions, status, alarms, cycles, loads and program steps.
- Welding parameters, welding equipment status, motor loads, electrical energy and filler wire consumption.
- Protocols: Ethernet, EtherNet/IP, Modbus/TCP, OPC UA and RS232; robot-to-equipment communication via Modbus for MIG/MAG and RS232 for laser systems.
- All records are classified by cell and timestamped with an accuracy of ±100 milliseconds.
- New data sources, including robots, machines, sensors and production lines, can be added without a complete system redesign.
02
2.2. Data Management Layer
- Centralized database for large volumes of production data using time-series / Big Data storage.
- Data aggregation, compression and long-term archiving with configurable retention policies.
- Data quality management, including filtering, validation and handling of missing or invalid records.
03
2.3. Analytics and Visualization Layer
- Web-based interface with real-time dashboards for operators, technical staff and management.
- KPIs covering efficiency, cycle time, workload, downtime, scrap, productivity by shift/operator/order, energy and consumables.
- Threshold-based alarms and notifications, trend analysis, and comparisons across periods, shifts, machines and products.
- Data and report export to Excel, CSV and PDF.
04
2.4. Advanced Analytics Modules
- Algorithms for automatic anomaly detection and identification of inefficient operating modes, providing a foundation for predictive maintenance.
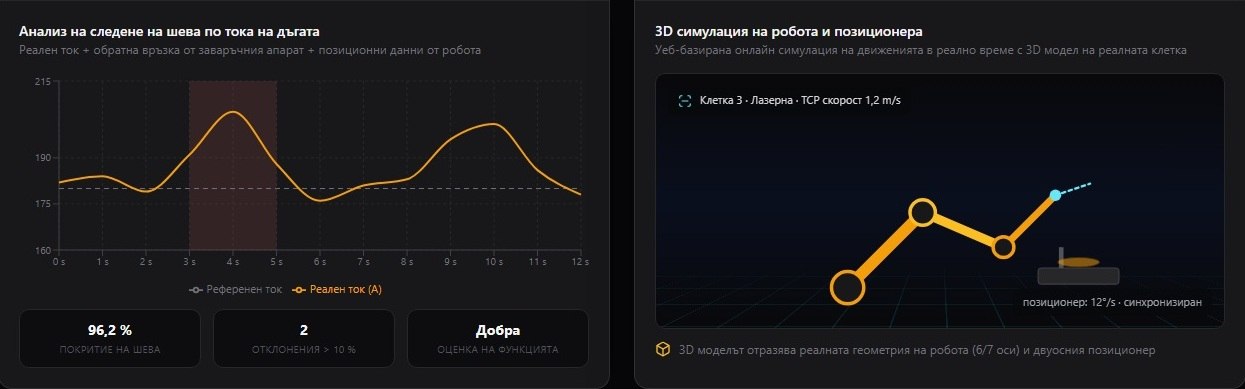
- Weld seam monitoring based on arc current, combining actual current, feedback from the welding equipment and positional data.
- Web-based 3D simulation of robot and positioner movements in real time.
05
2.5. Integration and Security
- ERP/MES/SCADA integration via APIs, web services and file exchange, including synchronization of orders, items and batches.
- Automated transfer of aggregated information, including KPIs and status data, back to existing systems.
- Audit logs, secure communication channels within the local network, and role-based access for administrators, engineers, operators and managers.
3. Architecture and Data Flow
The system uses a three-tier architecture complemented by an edge layer at the data sources. Each robotic cell records and processes data locally in real time, enabling continued operation even if the connection to the central database is interrupted. Data flows through acquisition, storage and management layers to the analytics layer, where information is made available according to user roles. A parallel integration path exchanges data with the enterprise ERP/MES/SCADA systems.
01
Edge Computing
Local recording and processing at each robotic cell.
→
02
Data Acquisition
Collection of machine and process data.
→
03
Data Storage
Centralized storage, validation and management.
→
04
Analytics
Dashboards, KPIs, reports and insights.
Enterprise System Integration
Bidirectional information exchange with enterprise systems through standardized interfaces.
ERP
MES
SCADA
API
4. Advanced Capabilities and Real-Time Dashboards
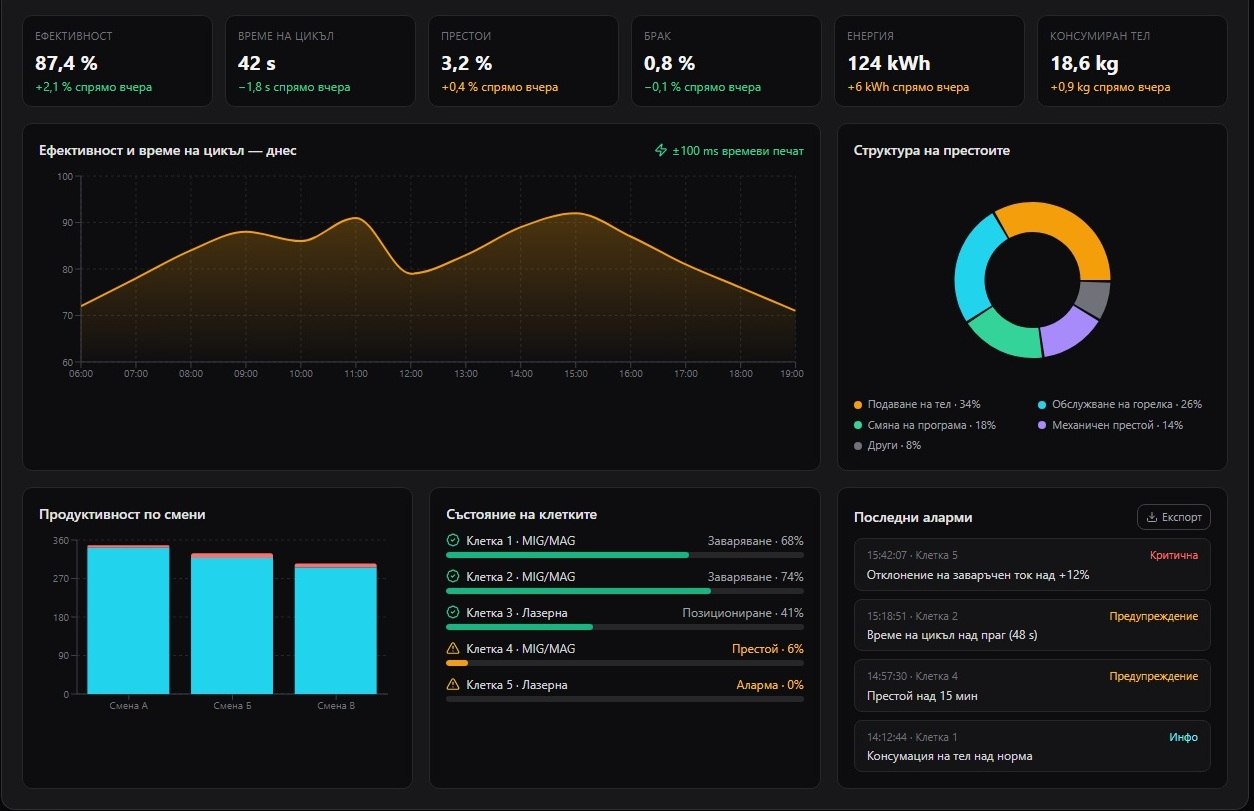
Real-time dashboards bring together key indicators for management and technical staff, including efficiency, cycle time, downtime, scrap, energy and consumables. They also provide efficiency trends, downtime breakdowns, shift productivity, individual cell status and alarm logs.
Dashboard Highlights
- Production efficiency and cycle time.
- Downtime analysis and alarm history.
- Scrap rates and production quality indicators.
- Energy and consumables monitoring.
- Productivity comparisons across shifts and operators.
- Live status of every robotic cell.
All data shown in the illustrative images is for demonstration purposes only.
5. Analytics and Reporting Screens
Analytical and reporting screens support detailed production monitoring, process optimization and internal control.
Trends and Comparisons
Compare performance across time periods, shifts, machines, products and operators.
Anomaly Detection
Automatically identify unusual behavior and provide information to support predictive maintenance.
Weld Seam Monitoring
Analyze arc current and highlight deviations using welding equipment feedback and robot positional data.
3D Robot Simulation
Visualize robot and positioner movements through a web-based 3D simulation module.
Export reports in:
Excel
CSV
PDF